Overview
Any Global Admin, Event Planner, or Reporting User can create a dashboard. Users can create any number of dashboards and share them with other users.
Viewing the Dashboard
To view the Dashboard (s), click on the toolbar's dashboard icon.
Creating and Configuring a Dashboard
To create a dashboard:
1) Navigate to Dashboards (Main Menu > Dashboard ).
2) Click Add Dashboard.
3) Enter a name for the Dashboard.
4) Check the Share My Dashboard to make it available to other users.
5) Press Save.
To add chart(s) to your Dashboard:
1) Select the Dashboard to modify in the dropdown box.
2) Click Add Chart.
3) Select the chart from the dropdown box to add to the Dashboard.
4) Press Add. The new chart will be displayed.
Sorting the charts:
Just drag and drop the charts in the order you want them displayed.
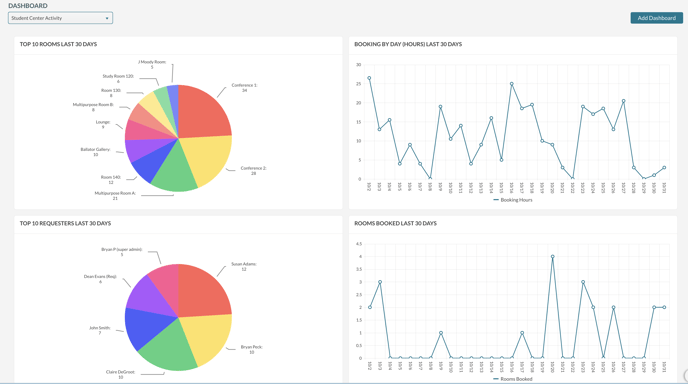
Charts Available
- Organizations Created - by Day for the previous 30 days
- User Accounts Created - by Day for the last 30 days
- Events Created - by Day for the previous 30 days
- Bookings Created (Hours or Count) - by Day for the previous 30 days
- Rooms Booked - by Day for the last 30 days
- Emails Sent - by Day for the previous 30 days
The following charts can show either the last 30 days or the next 30 days, and they're also filterable by building(s):
- Bookings by Day (Hours or Count)
- Top 10 Organizations
- Top 10 Rooms
- Top 10 Requesters
- Top 10 Event Coordinators