Overview
With the Quantity Used view, Mazévo provides a total quantity used by date for each resource across all bookings. This summary helps determine the usage of consumable resources like catering items. (How many gallons of coffee will be used on Monday? How many turkey sandwiches need to be made on Tuesday?)
The Quantity in Use view displays the quantity of inventoried items reserved by date and time. This report version provides the ability to identify situations where resource usage has exceeded inventory quantity. This is useful for determining if there are resources that are over-committed. (We have three data projectors, but four are needed next Wednesday at 3 p.m.)
The Requester Inventory Issues view displays the resources requested that exceeded inventory levels. In this situation, the quantity requested is captured but is not included in other resource usage reporting.
Running the Resource Usage Report
To run the report to determine, for example, the quantity used for all items this week in all buildings, you would set it up as follows:

Quantity Used
This format helps find the total usage of resources over a date range.
An example of the resulting output is:
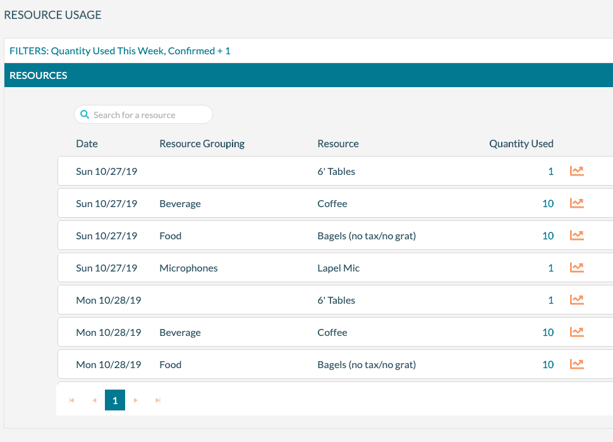
There is the option to collapse the daily display to just the total usage for the period selected.
Quantity In Use
This option helps find the hourly usage of resources to find overcommitted resources.
If the output option is Quantity in Use, on the other hand, the results are:
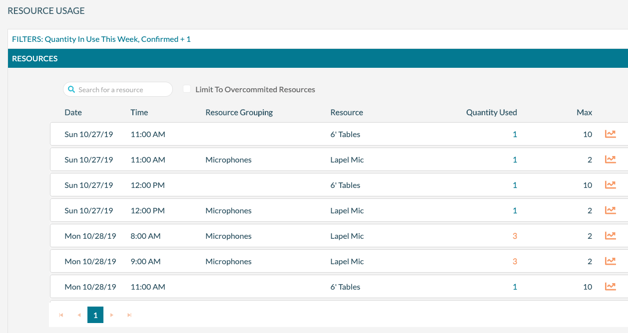
Notice that on Monday, October 28, the Lapel Mic has a quantity used that is greater than the quantity available. So, the quantity is highlighted, actually.
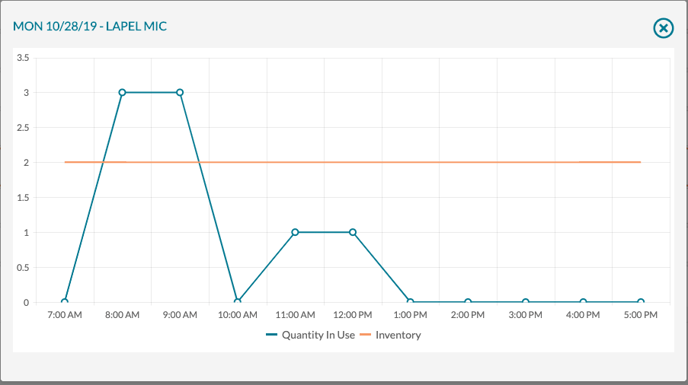
With either output option, clicking on the quantity displays the bookings using the resource. Also, for either output choice, clicking the graph icon displays a graph of the usage by hour:
Requester Inventory Issues
This option helps locate resources a requester entered that were unavailable during the booking process. Mazévo stores these overcommitted requests in a special table, allowing an event planner to process each resource flagged as overcommitted.
